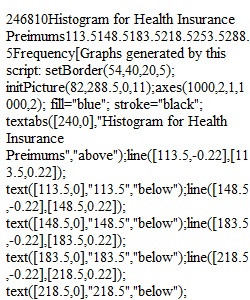


Q Question 1. Version 2*/2. Score: 17.74/24Expand Part 1 of 4 The Affordable Care Act created a market place for individuals to purchase health care plans. In 2014, the premiums for a random sample of 30 twenty-seven year olds who signed up for the bronze level health insurance are given in the table below ('Health insurance marketplace,' 2013). Create a frequency distribution and a relative frequency distribution using 5 classes. 181 153 141 151 163 286 166 119 204 125 143 192 186 170 121 203 165 186 114 189 139 176 139 190 145 162 156 185 177 185 ________________________________________ Since data were collected for one Correct variable, the correct graph to make is a Correct . Part 2 of 4 Using the formula class width=maxX-minXnumber of classes and rounding up to the next whole number, the class width is Correct Part 3 of 4 Complete the frequency/relative frequency table using 5 classes. Round relative frequencies to 3 decimal places. Class Frequency Relative Frequency 113.5 - Correct Correct Incorrect Correct - Correct Correct Incorrect Correct - Correct Correct Incorrect Correct - Correct Correct Incorrect Correct - Correct Correct Incorrect Part 4 of 4 Which of the following is the correct histogram for the given data? Question 2. Version 1*/1. Score: 18/24 Part 1 of 5 Students in a statistics class took their first test. The following are the scores they earned. Create a frequency distribution and histogram for the data using a lower class limit of 49.5 and a class width of 10. Describe the shape of the distribution. 75 51 90 91 87 94 90 69 92 84 98 82 88 63 93 92 95 75 73 86 82 80 88 73 92 ________________________________________ Since data were collected for one Correct variable, the correct graph to make is a Correct . Part 2 of 5 For this one the class width is given to be the following: class width = Incorrect Part 3 of 5 Complete the frequency/relative frequency table using the given class width. Round relative frequencies to 3 decimal places. Class Frequency Relative Frequency 49.5 - Correct Correct Incorrect Correct - Correct Correct Incorrect Correct - Correct Correct Incorrect Correct - Correct Correct Incorrect Correct - Correct Correct Incorrect Part 4 of 5 Which of the following is the correct histogram for the given data?
View Related Questions